14. Assess (Intro)
Assess: Intro
Properties of Data
141 Assess Intro V4
Quality
Low quality data is commonly referred to as dirty data . Dirty data has issues with its content .
Imagine you had a table with two columns: Name and Height , like below:
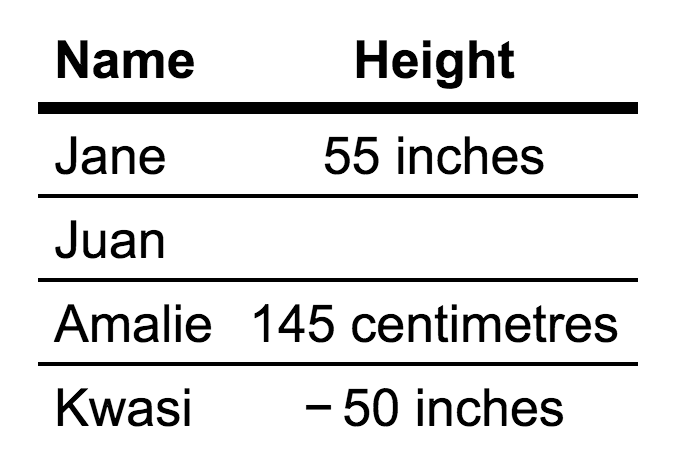
Common data quality issues include:
- missing data, like the missing height value for Juan.
- invalid data, like a cell having an impossible value, e.g., like negative height value for Kwasi. Having "inches" and "centimetres" in the height entries is technically invalid as well, since the datatype for height becomes a string when those are present. The datatype for height should be integer or float.
- inaccurate data, like Jane actually being 58 inches tall, not 55 inches tall.
- inconsistent data, like using different units for height (inches and centimetres).
We'll go over more tips and tricks to identify data quality issues and categorize them in the third lesson of the course.
Data quality is a perception or an assessment of data's fitness to serve its purpose in a given context. Unfortunately, that’s a bit of an evasive definition but it gets to something important: there are no hard and fast rules for data quality. One dataset may be high enough quality for one application but not for another.
Tidiness
Untidy data is commonly referred to as "messy" data . Messy data has issues with its structure .
Tidy data is a relatively new concept coined by statistician, professor, and all-round data expert Hadley Wickham . I’m going to take a quote from his excellent paper on the subject:
It is often said that 80% of data analysis is spent on the cleaning and preparing data. And it’s not just a first step, but it must be repeated many times over the course of analysis as new problems come to light or new data is collected. To get a handle on the problem, this paper focuses on a small, but important, aspect of data cleaning that I call data tidying: structuring datasets to facilitate analysis.
…
A dataset is messy or tidy depending on how rows, columns, and tables are matched up with observations, variables, and types. In tidy data:
- Each variable forms a column.
- Each observation forms a row.
- Each type of observational unit forms a table.
Tidy data animation from Lesson 3: Assessing Data
Tidiness will be covered in detail in Lesson 3. If you'd like more information now, this Tidy Data in Python article by Jean-Nicholas Hould is a good start.
Types of Assessment
Assess: Intro
Visual Assessment
Visual assessment is simple. Open your data in your favorite software application (Google Sheets, Excel, a text editor, etc.) and scroll through it, looking for quality and tidiness issues.
Programmatic Assessment
Programmatic assessment tends to be more efficient than visual assessment. One simple example of a programmatic assessment is pandas'
info
method, which gives us the basic info of your DataFrame—like number of entries, number of columns, the types of each column, whether there are missing values, and more.
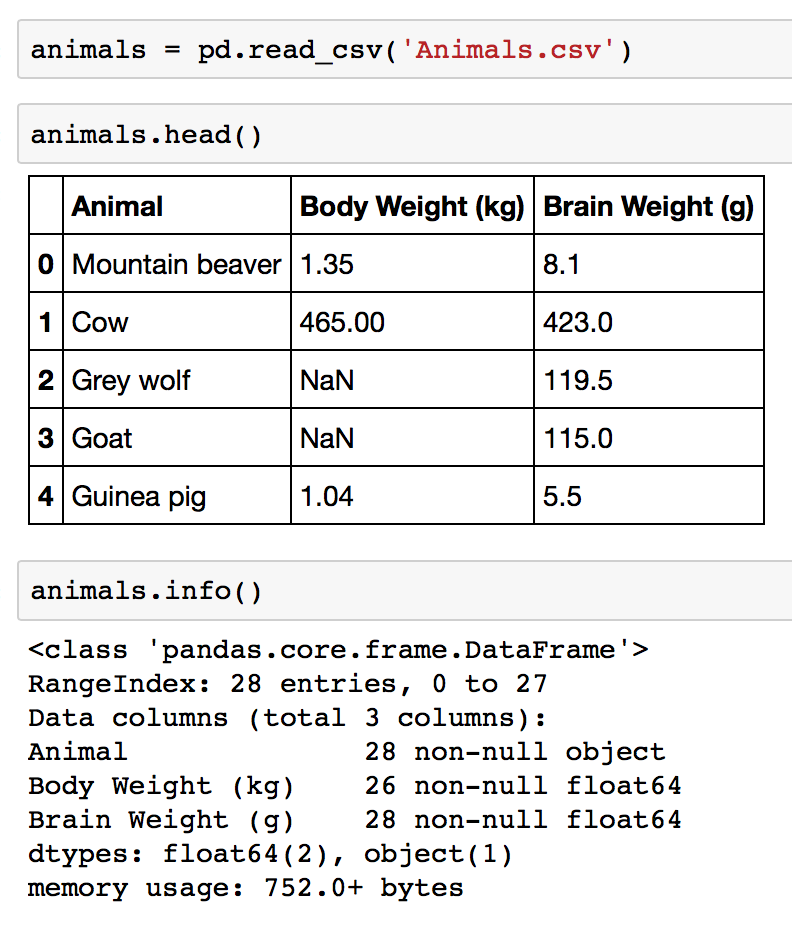
pandas'
info
method in action on a DataFrame called
animals
Another example is using pandas' plotting capabilities through the
plot
method, though simple visualizations are more common in exploratory data analysis (we'll discuss this later in this lesson) rather than data wrangling.
These types of assessments are handy for gauging your data’s structure and also for quickly spotting things that we’ll need to clean.